Activity gives you a clear picture of the work your agents have done — how much, which agents did it, where it came from, and what they produced — so handing work off never means losing track of it.

The whole point of a team of agents is that you stop doing the work yourself. But once you hand it off, a quieter worry creeps in: what's actually getting done back there? You delegated the briefings, the outreach, the reports. You trust it's happening. You'd just like to see it.
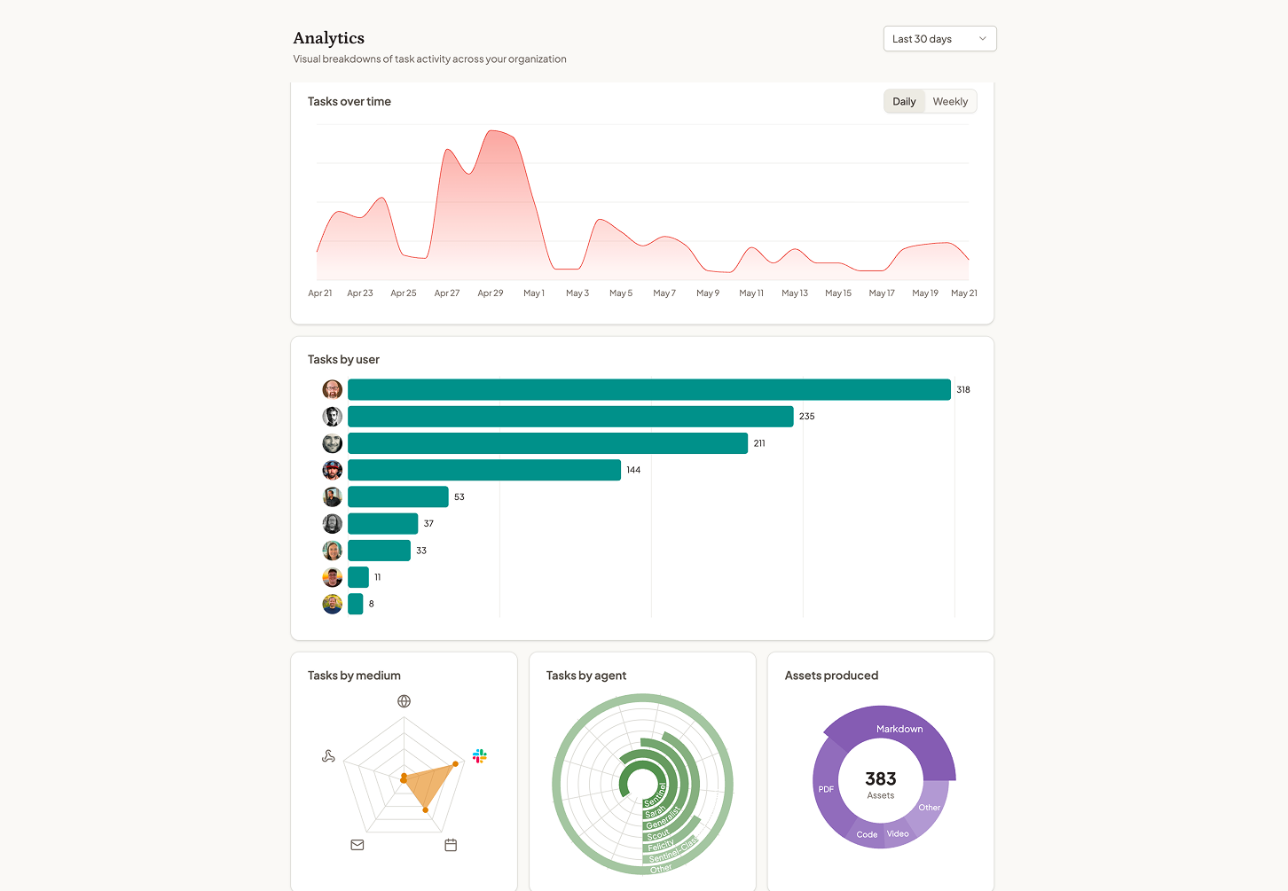
Activity is that view. It's a single page that shows you what your agents have been up to — not buried in logs, but as a set of plain charts you can read in a glance. Pick a window of the last 7, 30, or 90 days and the whole picture updates.
Here's what it shows you.
Key Takeaways
Work reaches your agents through more than one door. Some tasks you start in a chat. Some arrive by email. Some run on a schedule while you sleep. Some come in through a connected app. Activity shows the mix.
So you can tell how your team is really being used. Glance at the breakdown and you might find most of your work now flows in through chat, or that scheduled runs are quietly doing more than you realized. It's the difference between assuming how the agents get used and actually knowing.
Activity ranks your agents by how many tasks they've handled, so the workhorses are obvious at a glance and the ones sitting idle are too.
So you know which agents are earning their keep. Maybe your content agent is running constantly while another you set up months ago has barely been touched. That's a signal: lean harder on what's working, and rethink or rebrief the one that isn't.
Every document, spreadsheet, deck, and image your agents produce is an asset, and Activity breaks them down by type. You can see at a glance whether the month was mostly reports, mostly spreadsheets, or a stack of images.
So the output is something you can point to. When you're wondering whether all this is paying off, the assets chart is a straight answer: here's the pile of work that got produced, sorted by what kind it is.
Two more views round out the picture. One plots activity over time, so you can see the busy stretches and the quiet ones and switch between a daily or weekly view. The other shows which teammates are putting the agents to work.
So you can see momentum and adoption together. A rising line tells you the agents are becoming part of how the business runs. The teammate view tells you whether it's caught on across the team or still leans on one or two people.
What counts as a task in Activity?
Every run your agents complete shows up as a task, however it was started — from a chat, an email, a schedule, or a connected app.
Can I change the time period?
Yes. A selector at the top lets you switch between the last 7, 30, or 90 days, and every chart updates to match.
What does the assets breakdown include?
The files your agents produce — documents, spreadsheets, decks, images, and more — grouped by file type so you can see what kind of work came out.
Does it show which teammates are using the agents?
Yes. One of the views breaks activity down by the people on your team, so you can see how widely the agents have been adopted.
Handing work off should never mean flying blind. Activity gives you the picture — what got done, by whom, and what came out the other side. Learn more in the Help Center